How to monitor Node's performance?
This article explains how to use the server-side analytics dashboard in Pubstack to monitor Node's performance.
- Go to Analytics > Server-side Dashboard in the menu to access server-side analytics.

- You can select a date range to filter and display the data.

- The section on the right allows you to apply filters on sites, bidders, ad units, countries, and sizes. Click on a dimension to expand the selection list and apply a filter.

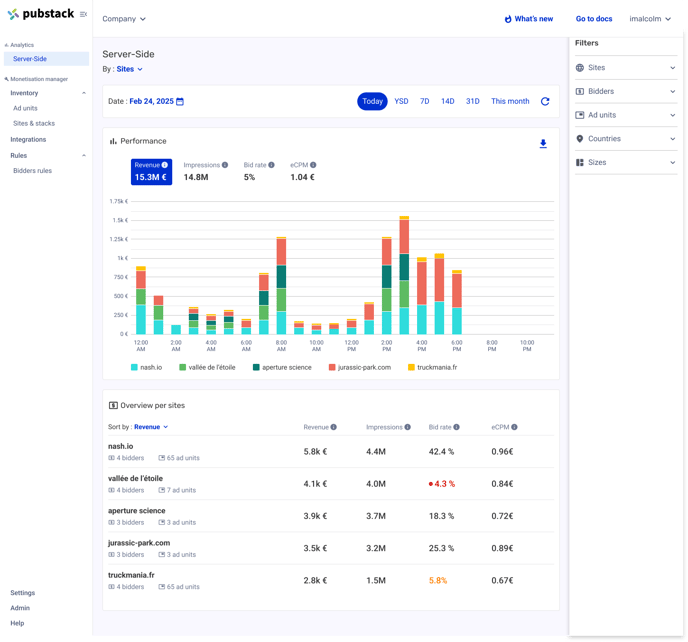
Server-side Overview
- This view displays overall performance with aggregated data from the Prebid Server.

- The Performance dashboard shows general metrics for the server-side solution. The available dimensions are:
- Revenue
- Impressions
- Bid rate
- eCPM
- Click a dimension to switch between data views.

- Revenue per Country displays aggregated revenue performance per country.

- Revenue per Site displays aggregated revenue performance per site.

Server-side view by Bidders
- This view shows overall performance broken down by bidders.

Server-side view by Sites
- This view displays overall performance broken down by site.
Server-side view by Ad units
- This view displays overall performance broken down by ad unit.

