Summarize Overview dashboard
The overview consists of a timeline, an explore view, and a breakdown by dimensions.
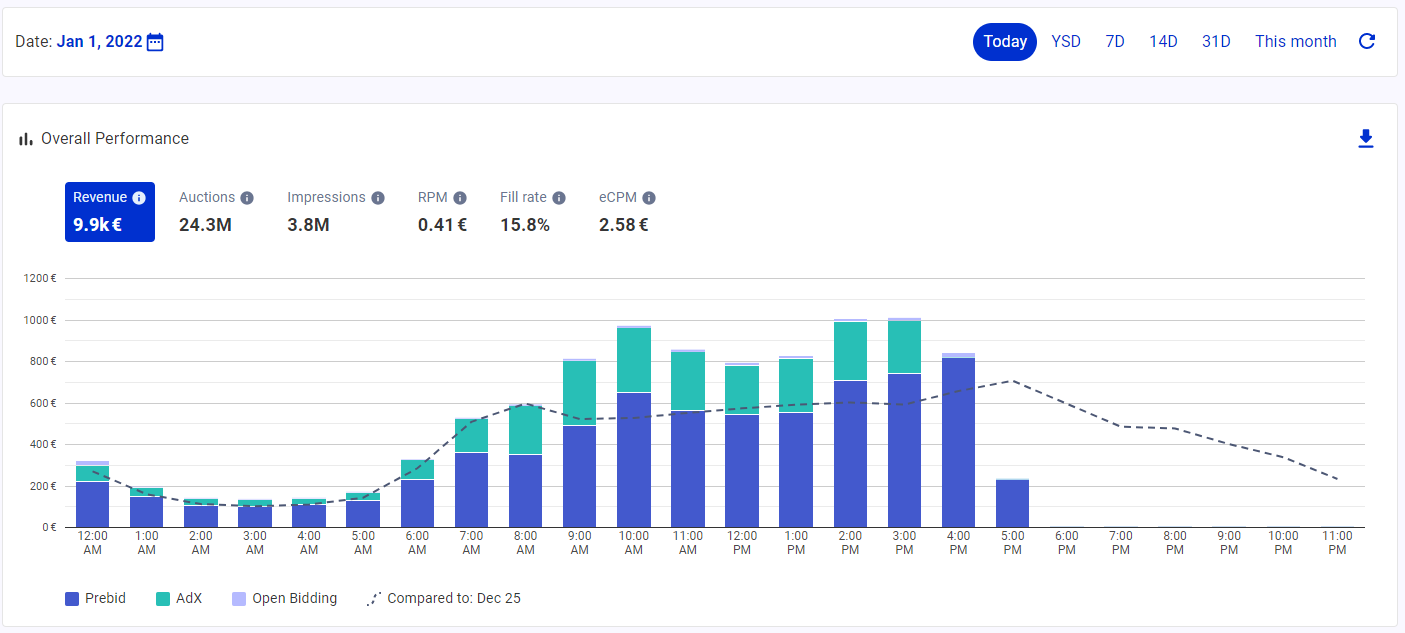
Timeline: you'll be able to monitor in real-time (5 minutes latency), apply time navigation, apply time comparison.
It will allow you to instantly detect errors after a modification on your stack, detect abnormal behavior, and analyze trends in different time periods.
Compared line (doted line): Line to compare the data of the selected timeline with the data of the previous 7 days.
Data display:
- If the timeline selected is less than 5 days, the data will be displayed hourly. This view will allow you to have a clear vision of any drop or peak on a day.
- If the timeline selected is above 4 days, the data will be displayed daily.
Screenshot :

Explore view: get access to multiple dimensions in a single place, include or exclude, batch select, search ...
Screenshot :

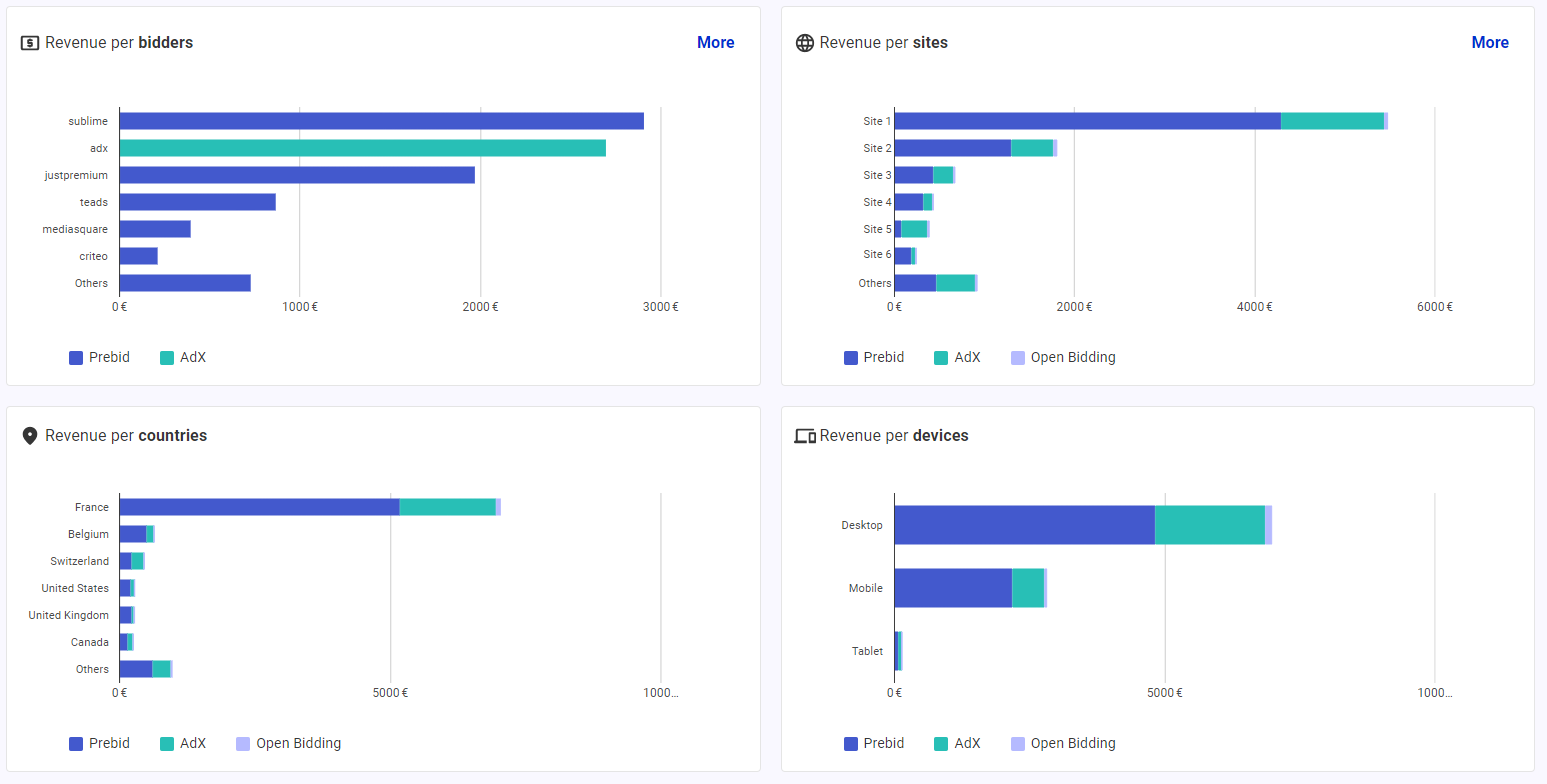
Breakdown: with a wide range of dimensions available, slice and dice to have access to granular data through interactive dashboard.
Dashboards are intended for AdOps, Yield Manager, AdTech Developers.
Find easily a very particular context (Filter on placement + site + format and select a timeline, for example on last 15 days)
Helps troubleshoot, by finding the root cause of a problem. For example, a drop in revenue, quickly identify if it comes from a particular bidder, or only affects a site, or a device ...
Screenshot :

