Summarize Sites Dashboard
The sites overview and the site view dashboards offer you a better understanding of your site's performance.
With the timelines and the breakdown widget, you will be able to quickly troubleshoot and understand your site's results.
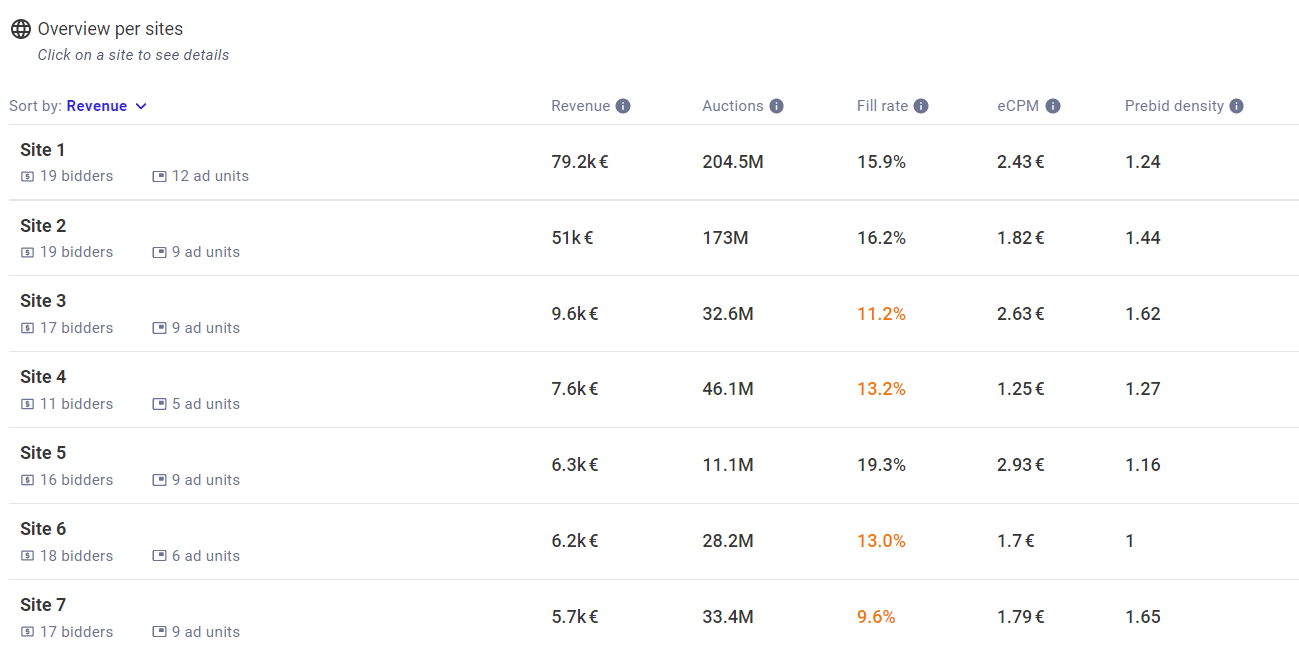
Sites overview
screenshot :

On each site, you have two icons:
 -> display the number of bidder called on the site
 -> display the number of adUnit called on the site
Pubstack will automatically highlight some values to help troubleshoot and/or optimize your set-up.
- Fill rate:
- If the bid rate is below 15%, the number will be orange
- If the bid rate is below 5%, the number will be red
Site view
Provides details on a selected site.
High granularity metrics at site level: ad units, devices, domains, countries.
Powerful to optimize site setup (example: target specific ad units, countries).Essential to monitor any setup modifications in real-time.
On this details page, you have 2 types of data available: Dashboard & Breakdown.
Dashboard:
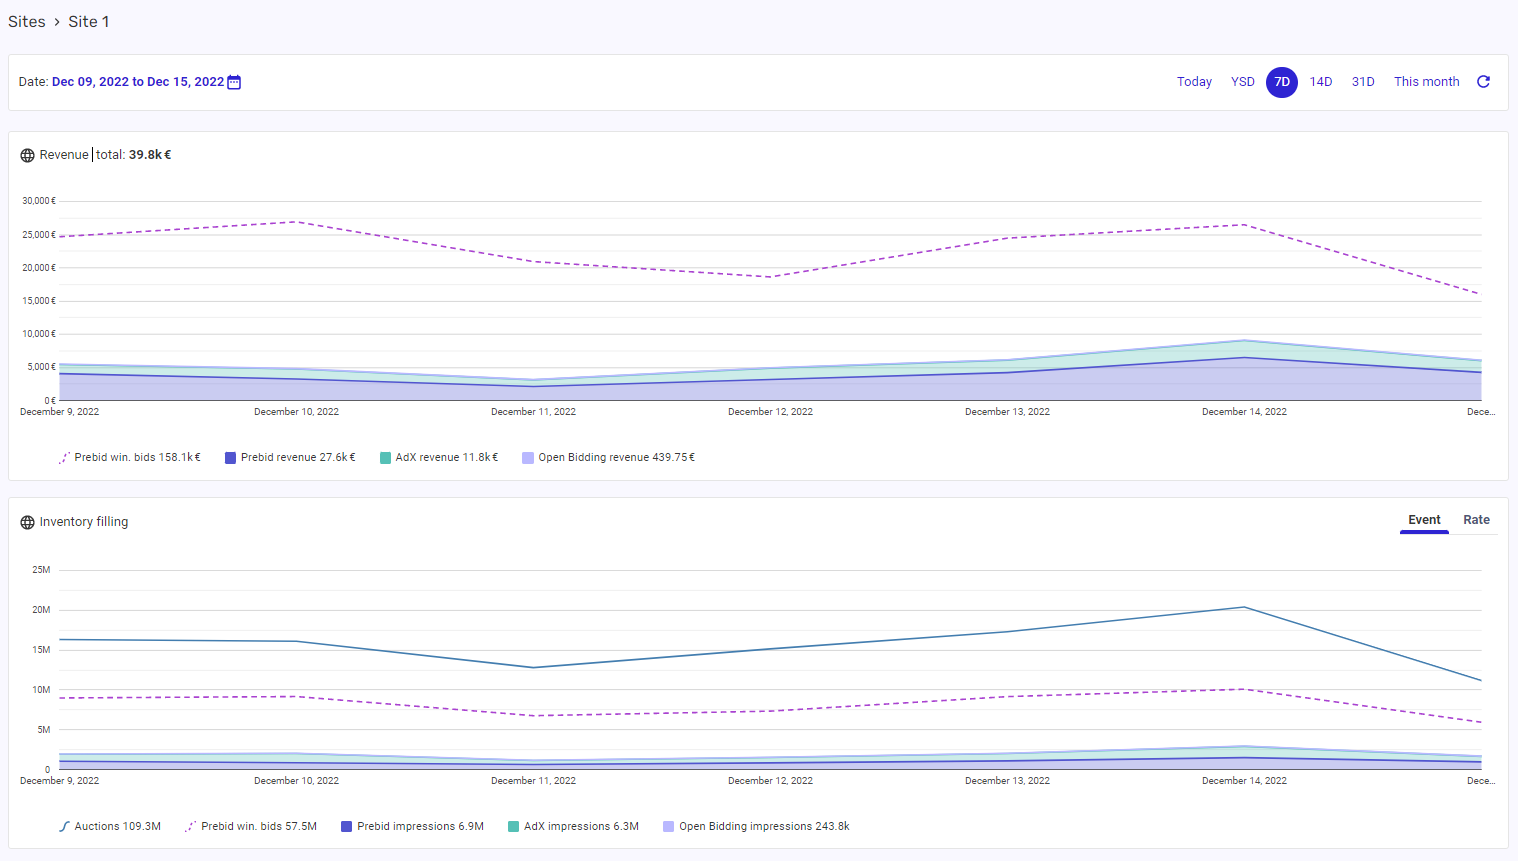
You will find 4 dashboards on the top of the page.
- Revenue: Display Prebid revenue, Prebid winning bids, Adx & Open-bidding revenue (if integration with GAM is performed).
- Prebid win. bids: Show how much Prebid generated on the Prebid environment (before competing against your adServer).
- Prebid revenue: Exhibit how much Prebid generated after winning against your adServer.
- Adx & Open-Bidding: Display data from GAM regarding the revenue generated by Adx and Open-Bidding.
- Inventory Filling: Data can be shown by percentage or raw number. Same value as before with also the number of auctions generated.
- CPM Breakdown: Display 3 lines Prebid eCPM, Adx eCPM & Open Bidding eCPM.
- Prebid Density: Display the average of the Prebid Density for the selected site.
screenshot :


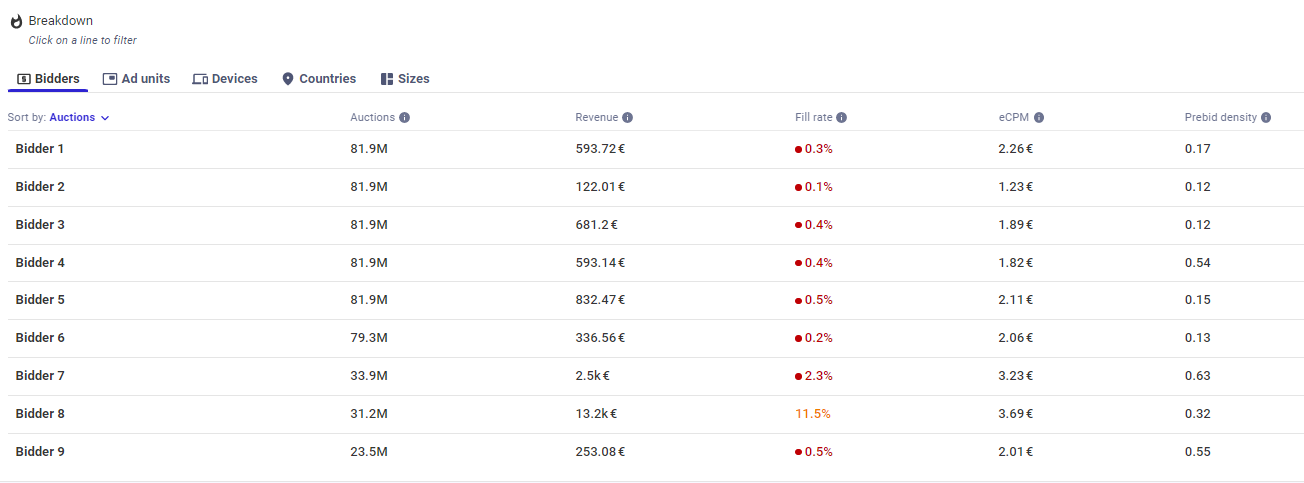
Breakdown:
View to give you a clear vision of your site. On each type, you will find the same information displayed on the site list (with the same color rules).
